Analyzing Our Own Social Scholarship Profiles

During our workgroup meeting this morning, Maria Ranieri has asked us to engage in an analysis of our own social profile(s), and to reflect on our decision to engage in social scholarship.

For me, the choice to engage in social media began over a decade ago, while still in graduate school at MSU. The first entry for my blog was in 2006, at the NWP-sponsored Tech Matters advanced institute, and my first tweet was in May 2007 (also at an NWP-related event). In a sense, the growth of social scholarship in the past decade has mirrored my own journey. I’ve always lived in the world that leaned toward open-access, collaboration, and public engagement, and I have grown my network exponentially over my past 10 years at CMU.

DuckDuckGo Screenshot of "Troy Hicks" Search
DuckDuckGo Screenshot of “Troy Hicks” Search

Today, it was interesting for me to “Google” myself. I actually started with DuckDuckGo in order to get a (relatively) objective look at what “Troy Hicks” yields. Here is what I found, with my annotations. Interestingly enough, I am not in the “top 10” of Facebook profiles for “Troy Hicks,” and I actually think that is a good thing. I did click on the LinkedIn search, too, and I showed up second, FWIW.

Then, I did hop over to Google. Here is what the automated complete function showed with just “troy hicks” and the with a “troy hicks d” (because I wanted to see what would happen with digital writing).

"Troy Hicks" on Google Search with Autocomplete
“Troy Hicks” on Google Search with Autocomplete
"Troy Hicks d" on Google Search with Autocomplete
“Troy Hicks d” on Google Search with Autocomplete

Interestingly, the “brookings sd” is for a man, Troy Doyle Hicks, 52, of Brookings, SD, who died last November. As soon as the “d” was added after my name, however, it is interesting to see that the connections to “digital writing” as well as my books showed up. Not sure that I need to buy another domain name right now, but that was an option, too.

She concluded by having us ask one another about affordances and opportunities as well as constraints and challenges. There were many, many points made, but I will focus on one: my profile on Rate My Professor. I haven’t been on the site in years (I had only seen the 2008 post) and was interested to read the 2015 post about my ENG 514 class. I can reflect more on my experience of teaching that class, how I established timelines/provided feedback, and what I have changed since, but that is for another post.

The other point I want to make now was captured best by Jillian Belanger in a tweet:

Tweet from Jillian Belanger

Onward! Looking forward to my next steps as a social scholar.


Creative Commons License
This work is licensed under a Creative Commons Attribution-NonCommercial-ShareAlike 4.0 International License.

Rethinking Scientific Argument with StoryMaps JS

This past week, I was able to cap off a summer whirlwind of PD at CMU’s Biological Station, facilitating what we are calling our first Beaver Island Institute. The six-day event brought together middle school science and ELA teachers for an opportunity to engage in scientific inquiry, explore argument writing in science, and understand aspects of disciplinary literacy. I was fortunate enough to work with two other facilitators, one graduate student, and 16 teachers as they began to develop units of study that connect the Next Generation Science Standards, the Common Core Literacy Standards, and the ISTE Technology Standards. Our main focus was on thinking about how students can pose questions, gather data, analyze that data and refine it into useful evidence, and then make scientific arguments.

Among the many great opportunities that happened, we explored three technologies to support digital writing: infographics (using Piktochart), graphic designs (using Canva), and something new (for me), a tool called StoryMap JS (not to be confused with Story Maps or MapStory, though those both look interesting, too) as a tool for creating presentations that blend map coordinates, images, videos, and text into a coherent “story map” that, indeed, has the map at the center of the story. StoryMapJS is open source, and many news organizations have used it to tell visual stories.

A sample of existing maps shows a variety of ways that users have imagined maps, from the Washington Post tracking the growth of ISIS to the Milwaukee Journal Sentinel’s map of craft breweries in Wisconsin.

As you will see in the sample Story Map that I created below, the cover/title slide is a map that contains all the subsequent points on the map. If you made a story map that was as small as one block in a town, it would zoom in that close; similarly, you could have multiple points represented all over the world with a much wider map in the opening.

The additional slides in the presentation included a space for entering an additional location, uploading (or linking to) an image, and also entering some text. In this space, students could write just about anything — a narrative that moves characters from one location to the next, a poem that describes the location, an informational piece that describes the cultural or scientific value of a particular location, or even evidence for a longer argument (as we discussed this week). The story map, then, can be shared and embedded.

Screenshot from StoryMap JS Interface

One additional tool that we used to help identify and, quite literally, pinpoint locations was GaiaGPS. Using their map tool, you can search for points of interest, zoom in and out to find other locations, and even drop pins to get exact GPS locations. I also learned from one of the participants that you can take GPS coordinates out of a Google Map, as seen in the close up of the URL bar below.

Close-Up of a Google Map Address Showing GPS Coordinates

One idea that I was imagining was that students could, while out taking pictures and videos of a space, be sure to record their location with GPS coordinates (or enable location services in the mobile app) and then have those exact spots. They could create walking tours of their communities, of natural areas, of historical sites, or — as one participant shared with me this week — they could capitalize on the Pokemon Go craze and make a series of geocaches for others to discover… or historical markers tagged with a QR code or Aurasma augmented reality.

This entire week has been valuable for me in many ways, especially as I was invited to think about connections between science and literacy. My hope is that the teachers who were involved in the institute will carry many new ideas back to their classroom this fall and, in turn, engage their own students in scientific inquiry and building arguments with evidence, evidence that they themselves have collected and analyzed.

StoryMap JS, with the opportunities it affords, could be one innovative platform for students to then share their work. Here is just a brief sample of one story map that I created as a model for the teachers.


Creative Commons License
This work is licensed under a Creative Commons Attribution-NonCommercial-ShareAlike 4.0 International License.

Hosting #engchat Next Week

This next Monday, Kristen Turner and I host #engchat for a conversation on Connected Reading. Here’s the announcement:

Recently, a friend of Kristen’s on Facebook posted a GIF that showed the evolution of a desk.  In 1980 the desk was covered with items: books, newspapers, magazines; a fax, phone, stapler and tape dispenser; a rolodex, clock, globe, calendar, and bulletin board; and a computer and phone.  One by one the items on the desk evolved – and disappeared, becoming an app on the computer – as a scrolling mast of years advanced.  By current day, only a computer full of apps and a Smartphone remained on the desk.

The GIF represents the possibilities of a digital world.  We can, if we choose to do so, conduct our professional and personal lives entirely on, with, and through devices, and a recent Pew study suggests that more and more teenagers and adults are making the choice to go digital.  What does this transformation mean?

As teachers of reading and writing, we recognize that our own desks – and those of our students – are markedly different than they were even just a decade ago.  We accept that, as the National Writing Project asserts, “digital is,” and we wonder how we can help adolescents to become critical readers in a world where they encounter short-, mid-, and long-form texts through their devices on a daily – and even hourly – basis.

For us, reading is not an isolating activity.  Digital tools allow individual readers to connect to a network of readers; texts of all kinds can be shared quickly and widely.  Digital tools also allow readers to share their reading experiences – before, during, and after – with others.  In a digital world, reading is visibly social.

In our book Connected Reading: Teaching Adolescent Readers in a Digital World, we describe a model of reading that takes into account the networked, social nature of reading today.

Screen Shot 2015-09-29 at 9.39.36 PM

This model suggests that readers encounter texts in a variety of ways.  They may receive them from others, somewhat passively, or they may actively seek out new reading material by surfing without much intention, stumbling through sites with some intention, or searching with focused intention.

How do we help students develop their comprehension skills as they encounter and engage with Kindles and Nooks, RSS feeds and Twitter, hypertext fiction and digital textbooks?  How do we help them to read critically in a world where information flows constantly?  And perhaps most importantly, how do we help them to leverage the possibilities within a network of readers?

As we consider these questions, we look forward to the #engchat session on October 5, where we will discuss what it means to be Connected Readers.

In the mean time, you might be interested in reading this recent feature article in NCTE’s Council Chronicle: Teaching Teens—and Ourselves—to Be Mindful, Connected Readers.

See you Monday on #engchat!

Update on 10/27/15: Courtesy of Momchil Filev, the video creator, I have updated the link of the video to the original file available from BestReviews.com.


Creative Commons License
This work is licensed under a Creative Commons Attribution-NonCommercial-ShareAlike 4.0 International License.

More Updates from AILA: Notes Visual Literacy and the Digital Workplace

Here are some notes from the first keynote was from Wibke Weber, in her talk about “Fusing words and images — new forms of public storytelling.”

  • In recent years, the rise of multimedia creates a complex milieu of words and images; they must be seen as equal partners in meaning making
  • Data visualizations
    • In the past few years, these have found a home in “data journalism” — a hybrid form using images, words, and numbers to create a new cohesive form
    • For a long time, images were viewed as the “little sister” of language and the fact that images could represent ideas was largely ignored
    • However, we know that visuals have more than an illustrative function — they can help narrate and make arguments
    • The semiotic system of language appears in the form of headlines, articles, captions, but numbers and maps show visual orientation and analysis
    • With the continuing forms of data visualizations, there are many new ways to represent ideas
    • The strength of data visualizations is that they provide evidence; they explain something visible that is difficult to understand in text alone (if designed well)
    • On the other hand, visual evidence can appear misleading and can look “objective,” but this is illusive. Even though they are based on numbers and texts, they are always the artifacts of an artist and/or design team. They are open to critique of color, font, shape, and more.
    • This means that we need to look at the data source, how it was collected, how it was visualized, and more. Words tell, but pictures show. So the main function of data visualization is to show, to tell a story.
  • How do images tell stories?
    • A data visualization must have a beginning, middle, and end
    • Famous graphic from Charles Joseph Minard that depicts the devastating losses in Napoleon’s army on their march to Moscow
  • Comics
    • The use of the comic medium to cover events, even in journalism, is at an all time high. For instance, they are being used in the Guardian and NYTimes.
    • Comic journalism is not about funny pictures, it means that you are pulling on the news and using journalistic techniques and ethics
    • Like narrative journalism, comic journalism covers the public story behind the private one
    • They can represent a variety of ideas and events, for instance this one about Ebola
    • The challenge for comic journalism is that, because comics are generally seen as fiction, people may struggle to see comic journalism as “true” and authentic
    • Journalists must use verbal and visual clues to share the fact that they are a part of the work (e.g., having a picture of the journalist in the comic, or by having a historical photograph of a person with their comic representation)
    • Colors, tone, light, shape, handwriting or print — all of these devices are ways that comics can be read for authenticity. Speech bubbles versus text boxes, too. The stylistic elements corroborate the authenticity of the comic.
    • It must be clear that the journalists are telling the truth, not a fictional story. This becomes even more important when illustrating breaking news and when using virtual reality.
    • What are the authentication strategies that we can use?
  • Research/dissertation drawn as a graphic novel
    • Nick Sousanis’s “Unflattening”
    • We are often unable to see past the boundaries of our current frame of mind — we need to bring the visual into academic discourse. It allows us to step outside of our own system and to see work in relation.

She has shared a great list of resources for infographics, and I thank her for allowing me to post them here:

Tools: 

Blogs and Tutorials:

Finally, Daniel Perrin shared his thoughts on “Investigating intercultural communication in the digital workplace”

  • AL Research Frameworks
    • Beginning with a “newspaper extinction timeline” from futureexploration.net
    • How do we begin to investigate solutions in this field
    • Combining many frameworks
      • Ethnography, grounded theory, Realist-social theory, Transdiciplinary action research, Dynamic systems theory
      • Connecting to real life problems
      • Change and stability
      • Agency and structure
      • Practitioners and researchers bring in their knowledge as experts
      • Collaborate and learn from one another
      • Learn and adjust goals, methods, and findings
      • To produce new, emergent, situated knowledge
      • Focusing on what works, for whom, under which circumstances
      • Not about the grand theory, but what works in certain contexts
  • The Idee Suisse Research Project
    • Focusing on SRG public broadcasting which is caught between a public mandate and private forces while being asked to stimulate public discourse
  • Macro level findings
    • In the program mandate, SRG is supposed to promote understanding, cohesion, and exchange across the various publics
    • Intercultural communication is a part of the media company’s mandate, but they don’t have the right tools and knowledge to bring together contradictory expectations of public discourse and compete against private, entertainment programs
    • Managers talk the talk, but do not walk the walk in propositional reconstruction — “public service media are not the institutions to solve social problems.”
  • Knowledge transformation from the ground floor — it doesn’t come from management, it comes from those who are doing the work
    • Understand the macro results
    • Take a closer look at experienced practice
    • Discover emergent practices and “third ways” out of critical situations
    • Deriving and telling the good practice story
    • Formulating guidelines for knowledge transformation measures
  • Data collection and analysis
    • What are the distinctions between what happens in the newsroom, in the conferences, and what appears on screen — recording the data during the course of a year
    • This is the “mother of spyware” that we installed — so we had to plan for ethical and practical aspects, also just having people know what we were doing and why
    • How do we do all of this in a theoretically and methodologically sound manner?
  • Conclusion: from tacit to explicit
    • We had to look at the hypocrisy framework — the organization is exposed to contradictory expectations. They must response to the conflicts in order to survive.
    • We also looked at the tacit knowledge frame — looking at how individual, experienced journalists filled in the slots left open by management. They develop strategies to meet organizational and public needs.
  • Looking at a specific case
    • Thinking about the writing situation, activity, and the strategies/practices
    • A particular journalist was highly experienced and was allowed to do “forbidden things” such as closing a story with a quote. He was a counter-conventional person and had the skills to be able to pull this off.
    • He would write the text after composing the video with the editor.
    • He would also write the introduction for the anchor woman himself; this is uncommon, because the journalist normally writes the story and the anchor writes her own introduction
    • Normally, the anchor’s introduction is about selling the news piece. But, for this journalist, it is really important that the anchor provides context for the piece. He knows how to tell about complex things in a simple manner.
    • The journalist goes through a very linear writing process for the anchor’s part of the story. His own writing process is a bit more recursive, but he is able to get the info for the anchor created in a very linear manner.
  • In a more abstract format… writing strategies in a propositional format
    • To distinguish between the two stories (background and current)
    • To tell the recent story in the news text because it fits the recent pictures
    • To tell the background story because not all the audience is up-to-date
    • To tell the background story in the anchor text because there are no pictures
    • In short, there was a high degree of intercultural communication between the journalist and the anchor (different professional cultures within the organizations)
  • What are the strategies that the journalist uses across the writing process?
    • Goal setting
    • Planning
    • Controlling
    • Revising
    • Defining the task
    • Implementing the product
    • Reading sources
    • Reading the text so-far
    • Handling writing tools
    • Handling task environment
    • Handling social environment
    • Establishing relevance for the audience
    • Finding the sources
    • Holding space and time restrictions
    • Limiting the topic
    • Staging the story
    • Taking own position
    • Revisions
  • This differs from the traditional Flower and Hayes model, where a student is given a task that they are supposed to do for school
    • But, in real life, writing requires goal setting well before planning
  • The “good practice” story
    • Whereas critical situations denote exemplary constellations of circumstances which could lead to failure, good practice stands for potential success for everyone involved in creating the story.
    • Production conflicts force an emerging solution
    • Orientation to uptake to complicating action to resolution to coda
  • “what works for whom in what circumstances” (Pawson and Tilley, 1997)
  • Research-based guidelines for knowledge transformation measures
    • Fostering conditions as drivers of emergence
    • Ensure experience in teams
    • Facilitate negotiation
    • Promote variation
    • Reflect routes and develop repertoires
    • Expose to the unexpected — and remain open to it
  • Conclusion
    • Applied linguistics research shows and fosters intercultural communication on three levels
      • between societal groups of a multicultural society
      • between professional cultures within the broadcast company
      • between practitioners and researchers in trasndisciplinary collaboration
    • Linguists can identify, analyze, and solve problems related to real-life issues

Creative Commons License
This work is licensed under a Creative Commons Attribution-NonCommercial-ShareAlike 4.0 International License.

Rewiring Research on Teachers Teaching Teachers

This past week, I was able to join in a conversation with my good friend and colleague, Dawn Reed, on an episode of Teachers Teaching Teachers so we could talk about our forthcoming book, Research Writing Rewired: Lessons That Ground Students’ Digital Learning. Enjoy!


Creative Commons License
This work is licensed under a Creative Commons Attribution-NonCommercial-ShareAlike 4.0 International License.

Introducing Assessing Students’ Digital Writing

Assessing Students' Digital Writing: Protocols for Looking Closely. Edited by Troy Hicks. Co-Published by NWP and TCP.
Assessing Students’ Digital Writing: Protocols for Looking Closely. Edited by Troy Hicks. Co-Published by NWP and TCP.

By all measures, I am fortunate to work with so many incredible colleagues from the world of education, both K-12 and higher ed. Many times those collaborations happen in just a few hours, or a few says, and they then disappear.

However, sometimes they last for months or even years, and they transform into something much more powerful. Assessing Students’ Digital Writing: Protocols for Looking Closely is one such example of that powerful kind of collaboration.

Here is the book’s description:

Troy Hicks—a leader in the teaching of digital writing—collaborates with seven National Writing Project teacher-consultants to provide a protocol for assessing students’ digital writing. This collection highlights six case studies centered on evidence the authors have uncovered through teacher inquiry and structured conversations about students’ digital writing. Beginning with a digital writing sample, each teacher offers an analysis of a student’s work and a reflection on how collaborative assessment affected his or her teaching. Because the authors include teachers from kindergarten to college, this book provides opportunities for vertical discussions of digital writing development, as well as grade-level conversations about high-quality digital writing. The collection also includes an introduction and conclusion, written by Hicks, that provides context for the inquiry group’s work and recommendations for assessment of digital writing.

Screenshots of Students' Digital Writing
Screenshots of Students’ Digital Writing from NWP’s Digital Is Website

Moreover, each of the book’s chapters include online resources available at NWP’s Digital Is website. One note here is a huge shoutout to my friend and NWP colleague Christina Cantrill who has made the companion site on Digital Is a possibility. There are six different pieces in the collection, including:

My sincere hope is that the student work shared in this collection and online will spark dialogue amongst teachers about when, why, and how they can and should integrate digital writing into their classrooms. If you have questions, please let me know.


Creative Commons License
This work is licensed under a Creative Commons Attribution-NonCommercial-ShareAlike 4.0 International License.
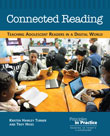
Introducing Connected Reading

Connected Reading Cover (Courtesy of NCTE)

This month marks the publication of my fifth book, a co-authored work with Kristen Hawley Turner entitled Connected Reading: Teaching Adolescent Readers in a Digital World.

The research and writing process for this book took over two years, though it was well worth the effort. Combined, Kristen and I visited a dozen classrooms, interviewed nearly two dozen students, and surveyed 800 teens about their uses of digital reading devices. We discovered that reading was about much more than just the device; it remains, at the heart of it all, a conversation about words, stories, and ideas. Here is the official “blurb” from the back of the book:

As readers of all ages increasingly turn to the Internet and a variety of electronic devices for both informational and leisure reading, teachers need to reconsider not just who and what teens read but where and how they read as well. Having ready access to digital tools and texts doesn’t mean that middle and high school students are automatically thoughtful, adept readers. So how can we help adolescents become critical readers in a digital age?

Using NCTE’s policy research brief Reading Instruction for All Students as both guide and sounding board, experienced teacher-researchers Kristen Hawley Turner and Troy Hicks took their questions about adolescent reading practices to a dozen middle and high school classrooms. In this book, they report on their interviews and survey data from visits with hundreds of teens, which led to the development of their model of Connected Reading: “Digital tools, used mindfully, enable connections. Digital reading is connected reading.”

They argue that we must teach adolescents how to read digital texts effectively, not simply expect that teens can read them because they know how to use digital tools. Turner and Hicks offer practical tips by highlighting classroom practices that engage students in reading and thinking with both print and digital texts, thus encouraging reading instruction that reaches all students.

We summarize our model in this graphic, and hope that it sparks conversations about the nature of reading in a digital world.

Connected Reading: Teaching Adolescent Readers in a Digital World Graphic
Connected Reading: Teaching Adolescent Readers in a Digital World by Kristen Hawley Turner and Troy Hicks © 2015 by the National Council of Teachers of English. This figure may be printed, reproduced, and disseminated (with attribution) without permission from NCTE.

Check out the first chapter on NCTE’s website as well as our companion wiki. We look forward to continued conversations about connected reading among teachers, parents, and, of course, our students.

Digital Media in Content Area Learning

Earlier this week, Liz Piazza asked:

At the time, I didn’t think I could answer in 140 characters, and I’m glad that I didn’t try.

There are quite a few things to consider when answering this question, and perhaps it was simply the word “all” that threw me for a loop. Well, yes, in all content areas. I think. Wait, maybe not all. Most? Some?

You can see how I pondered the question, turning it over in my mind.

In doing so, however, I also began to think about the goals for content area literacy or, as it is being described more and more — especially by Tim and Cindy Shanahan — disciplinary literacy. And, in fact, their definition is at the crux of how I would answer the question. They believe that “Most students need explicit teaching of sophisticated genres, specialized language conventions, disciplinary norms of precision and accuracy, and higher-level interpretive processes” (43) and “the nature of the disciplines is something that must be communicated to adolescents, along with the ways in which experts approach the reading of text. Students’ text comprehension, we believe, benefits when students learn to approach different texts with different lenses.” (51).

Image CC Licensed by Flickr User Dan Zen

So, my short answer to Liz’s question would have been, “Yes, various forms of new media such as social networking and gaming can be successfully used in various content areas, perhaps even all of them,” as evidenced by tools such as EASE History, the Science Game Center, the National Library of Virtual Manipulatives, or any of the dozens of options available on this K-12 Tech Tools wiki. Students have created videos about science experiments and historical reenactments, and acted as characters from literature or actual historical figures on Twitter and Facebook.

So, yes, they can.

The deeper answer, and the one that I have been struggling with over the week, however, is a little more complicated.

If we think about the Shanahans’ ideas that content area literacy is quite a bit more specific than simply applying a general set of strategies for writing-across-the-curriculum — as good as those strategies may be — then there has to be something deeper, something more rhetorical, to the idea of composing a disciplinary text with multimedia. Returning to Liz’s question, and pivoting it just a bit, I wonder: Can various forms of new digital media be effective as a tool for composing in all disciplines? 

Here, the answer gets a bit murkier, mostly because I am not a disciplinary expert outside of the field of writing. On the one hand, I can imagine that expressing disciplinary knowledge in math, science, history, or the arts — demonstrating a way of thinking through expert interpretation, analysis, and communication — could happen in any form of media. Heck, a whole movement in education, the flipped classroom, has come about because teachers have taken up the idea that they can create and deliver lessons via online video at least as effectively, if not more so, than they can do in the classroom. So, multimedia exploration of disciplinary knowledge is, conceivably at least, possible.

On the other hand, I wonder what is lost when transitioning from writing (words into sentences into paragraphs types of writing) into multimedia composition? Are there components of disciplinary thinking that don’t translate well from words to images to video to links to… whatever other form of media we can imagine?

At the same time, what do disciplinary experts gain in the process of being able to use images, voice, video, links, and other forms of media? How can they use multimedia to more fully express their ideas? What is it that we want to know about learning math — or science or music or art or anything — that multimedia can offer above and beyond print?

Liz’s question has pushed my thinking this week, and for that I thank her. I’m hoping that this response pushes her thinking, too, as well as yours. What does it mean to compose, as a disciplinary expert, with digital writing tools?

Lastly, and on a related note, for more of my thoughts on disciplinary literacy from an English Language Arts perspective, this chapter could be useful:

Hicks, T., & Steffel, S. (2012). Learning with Text in English/Language Arts. In T. L. Jetton & C. Shanahan (Eds.), Adolescent Literacy in the Academic Disciplines General Principles and Practical Strategies. New York, NY: Guilford Press.

Creative Commons License
This work is licensed under a Creative Commons Attribution-NonCommercial-ShareAlike 4.0 International License.

Keynote from Reinventing the Classroom 2014 Virtual Conference

My thanks to Steve Hargadon for an invitation to speak during the Reinventing the Classroom virtual conference last week. The archive of my webinar is available on YouTube.


Creative Commons License
This work is licensed under a Creative Commons Attribution-NonCommercial-ShareAlike 4.0 International License.

WRAB III: Writing As Multimodal Text Production

Here are slides from my talk, “Writing as Multimodal Text Production.”

[iframe]<iframe src=”https://docs.google.com/presentation/d/1_z9oiSEUmE_-aRtI1QEozNNbY5kmiAVxcCNJnUjYa6Y/embed?start=false&loop=false&delayms=3000″ frameborder=”0″ width=”960″ height=”569″ allowfullscreen=”true” mozallowfullscreen=”true” webkitallowfullscreen=”true”></iframe>[/iframe]


Creative Commons License
This work is licensed under a Creative Commons Attribution-NonCommercial-ShareAlike 4.0 International License.